Lab Metadecidim -Session 10- decidim.viz. Data Visualization for democratic participation
Lugar
:
Laboratorio de Innovación Democrática (Fàbrica de Creació Fabra i Coats Carrer de Sant Adrià, 20, 08030 Barcelona) - Tercera planta
Fecha
:
Introduction:
The digital revolution that has led to the rise of information and communication technologies has not only transformed the ways of relating among people, but has also generated the possibility of generating large repositories of data with the activity of each of them. Their study, through computational resources, has opened a new scientific horizon by the possibilities they offer when it comes to analyzing, modeling, simulating and, in short, understanding social phenomena [1]. However, the interpretation of these data often requires techniques that allow transforming them into understandable information. With this purpose, the visualization of data becomes a very effective strategy when trying to find a balance between perception and cognition in order to take advantage of people's brain capacities [2].
Democratic participation is not exempt from being the subject of visualization techniques. On the contrary, any civic platform is obliged to present its information for different reasons: provide relevant information to the participants, facilitate decision-making in complex matters, offer accountability mechanisms for decisions made, guarantee transparency policies, etc. However, despite the different recommendations on how to offer quantitative information in a visual way [3,4,5], there are no specific guidelines to date in the framework of citizen participation, technopolitics, or democratic innovation.
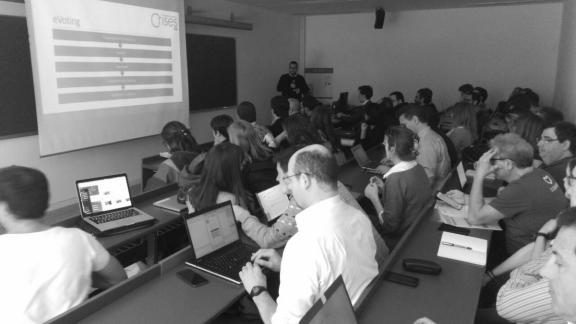
Taking advantage of the imminent task of incorporating advanced features of data visualization in Decidim, added to the completion of the specification of the ontology of the platform, it is considered strategic to hold a work session oriented to the visualization of data for democratic participation. Consequently, the aim of this tenth seminar of the Lab Metadecidim is to review, propose and discuss the best strategies when viewing the Decidim data repository in order to improve democratic participation.
[1] Lazer D, Pentland AS, Adamic L., Aral S., Barabasi AL, Brewer D., Christakis N., Contractor N., Fowler J., Gutmann M., Jebara T., King G., Macy M ., Roy D., & Van Alstyne M. (2009). Life in the network: the coming age of computational social science. Science (New York, NY), 323 (5915), 721.
[2] Few, S. (2013). Data visualization for human perception. The Encyclopedia of Human-Computer Interaction, 2nd Edition.
[3] Wertheimer, M. (1923). A brief introduction to gestalt, identifying key theories and principles. Psychol Forsch, 4, 301-350.
[4] Tufte, E. (1983). The visual display of quantitative information. Number v. 914 in The Visual Display of Quantitative Information.
[5] McCandless, D. (2012). Information is beautiful (pp. 978-0007294664). London: Collins.
Challenge
Review, propose and discuss different collaborative strategies and free technologies to visualize the data repository that is generated in Decidim in order to improve democratic participation.
Questions:
- What opportunities does data visualization offer in the context of citizen participation and radical democracy?
- What data from the Decidim ontology should be presented using visualization tools? How can data visualization be used not only as an exercise in transparency but also as an empowerment exercise?
- What are the risks of data visualization in Decidim if it is required to preserve sensitive information from citizens? What are the recommended strategies to optimize data visualization and respect for privacy?
- Is there a balance between offering static and descriptive visualizations (reporting) and offering interactive and exploratory visualizations (dashboards)?
- Given the open license of Decidim, which free data visualization technologies are the most appropriate?
- Given the participatory nature of the Metadecidim community, what collaborative methodologies exist in the field of data visualization?
Projecte
Más información
Información útil
Más información e inscripciones aquí
Programa
Programa*:
de 10 a 10:10 - Presentación del reto por parte del equipo del Metadecidim Lab
de 10:10 a 11.30h - Presentaciones de los ponentes
David González, Vizzuality
Luz Calvo, Barcelona supercomputing Center
David Laniado, Eurecat
y debate con la fila 0:
Marius Boada, Ajuntament de Barcelona
Mar Santamaría, 300000kms
Oliver Valls y Carles Rodellar, Codi tramuntana
Álvaro Ortiz, Populate tools
Debate
*Programa sujeto a cambios
This question is for testing whether or not you are a human visitor and to prevent automated spam submissions.
